

Understanding P-Values: What They Really Mean
In the world of statistics, p-values are like a secret code that helps researchers decide if their results are meaningful. However, they can be tricky to interpret, and many people make mistakes when trying to understand them. If you’re feeling confused about these values, don’t worry—you’re not alone! In this blog post, we’ll explain what they actually mean. We will also show you how to avoid common pitfalls when interpreting results.
What Is a P-Value, Anyway?
Let’s start with the basics. The “p” in p-value stands for “probability.” A p-value is a number that helps you decide if your experiment’s results are meaningful. It also assesses whether they could have happened by chance. It tells you how likely the observed results are due to random variation. This assumes there’s no real effect.
For example, imagine you’re testing a new drug. After running the experiment, you find that the drug seems to have a positive effect. But how can you be sure the drug is actually making the difference? Could the results just be a coincidence? This is where the number comes in.
If the value is small, it suggests that the observed effect is unlikely to be random. For instance, if you get a p-value of 0.03, that means there’s only a 3% chance the results happened by chance. This is still below the 0.05 threshold, meaning it’s statistically significant. Still, it’s not as extreme as a value like 0.0001. In this case, you might also consider other factors. You could evaluate the effect size to find the real-world importance of the results.
On the other hand, a larger number, like 0.20, suggests that the results could have been due to random chance, meaning there’s less confidence in the observed effect.
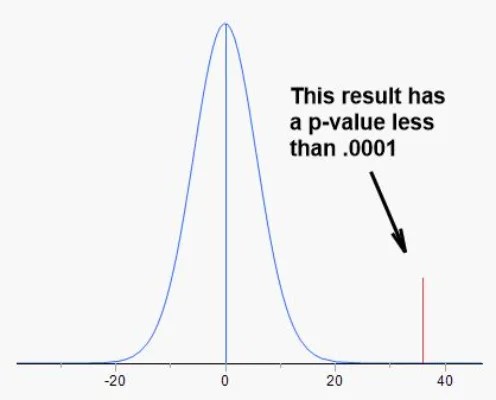
In short, a p-value helps you decide whether to reject the null hypothesis (the idea that there’s no real effect). The smaller the number, the stronger the evidence against the null hypothesis. For example, a p-value of 0.0001 means that there’s only a 0.01% chance the observed results happened by chance. In this case, it would be reasonable to reject the null hypothesis and conclude that the effect is real.
The Magic Number: 0.05
One of the most famous thresholds in many studies is 0.05, often considered the gold standard. When researchers see a value below this threshold, they often conclude, “This is statistically significant!” But don’t jump to conclusions just yet!
A number below 0.05 means there’s less than a 5% chance the result is due to random variation. So, if you get a result of 0.03, it suggests there’s only a 3% chance that the results occurred by accident. Sounds pretty convincing, right? But here’s the catch: this figure is not a guarantee that your results are true or meaningful. It’s just a measure of probability. It tells you how likely it is that you’re seeing something real, but it does not prove it.

What Happens If Your Number Is Above 0.05?
Let’s say the value is above 0.05—what does that mean? It does not mean your study is a failure or that your hypothesis is wrong! A result above 0.05 simply indicates a higher chance that your findings occurred randomly. In such cases, researchers may not declare their results “statistically significant.”

However, keep in mind that just because a result is not statistically significant doesn’t mean it’s unimportant! Studies with small sample sizes or other factors can still produce results that matter. In the real world, even a small effect can still be meaningful, even if it doesn’t meet the traditional threshold.
The P-Value Is Not the Whole Story
While p-values are a helpful tool, they’re not the only statistic to rely on when analyzing data. Think about it this way: imagine you’re buying a new phone, but you only look at the price tag. You’d miss out on important details like features, reviews, or battery life. The same principle applies to p-values.
Other statistics, like effect size and confidence intervals, give you a better understanding of how reliable the results are. For example, a very small p-value with a tiny effect size might not actually matter much in the real world.
At Topline Statistics, I help my clients understand various statistical tools. This enables them to make the most out of their data. If you’re unsure about how to interpret your own results, I’ve got you covered!
P-Values Don’t Prove Anything
Here’s one of the biggest misconceptions about p-values: they do not “prove” anything. A p-value doesn’t confirm that your hypothesis is true. It simply tells you if the data you’ve collected is consistent with your hypothesis.
Think of it like this: a p-value is like a referee at a soccer game. It doesn’t decide who wins; it just ensures the rules are followed. Even with a very small number, you can’t automatically assume your theory is correct. You’ll need to consider the broader context, including experimental design, sample size, and other statistical tests.
Common Pitfalls When Interpreting P-Values
Now that we understand p-values, let’s talk about some common mistakes people make when interpreting them.
Overlooking other factors: As mentioned earlier, p-values are not the only statistic to consider. Always factor in other elements, like effect size and confidence intervals, for the full picture.
Assuming a p-value of 0.05 means a 95% probability: Many people mistakenly think that a p-value of 0.05 means there’s a 95% chance the results are correct. This is wrong! It only means there’s a 5% chance that the results are due to chance.
Ignoring sample size: A small p-value is exciting. However, if your sample size is tiny, the result might not be reliable. A study with just 10 participants could give you a number less than 0.05, but that doesn’t mean the findings are trustworthy. Larger studies usually provide more reliable results.
Conclusion: P-Values Are Not the End-All, Be-All
In conclusion, p-values are a helpful tool, but they should not be the only focus when interpreting statistical results. Always remember that the p-value is just one part of the puzzle. If you’re unsure about how to interpret your data, reach out to Topline Statistics for expert advice. We offer data services to help you understand your numbers and avoid common statistical pitfalls.
By understanding p-values and other statistical measures, you’ll be able to draw more reliable conclusions from your data. This will help you avoid some of the most common mistakes researchers make.
Want to learn more about statistical concepts like p-values, or need help analyzing your data? Check out my other blogs on the Topline Statistics website or contact me for professional assistance today!
All graphs were created using my favorite statistical software, JMP.
Discover more from Topline Statistics
Subscribe to get the latest posts sent to your email.
Are you drowning in data?
Let us help! Our experts will navigate, organize, and analyze your data, bringing forth clarity and actionable recommendations.