

The Tools Statisticians Use: A Peek into Data Magic with JMP
When you hear the word “statistician,” you might think of someone hunched over a desk with a pencil, scribbling numbers on paper. But that’s only part of the story! Statisticians are like data detectives, using various tools to find hidden patterns and insights in the numbers. They don’t just work with pencils and calculators anymore; they have a whole arsenal of technology at their fingertips.
Organizing Data: Essential Tools for Statisticians
First of all, organizing data is like putting your room in order before you can find anything. Imagine looking for your favorite video game in a messy room. You’d probably end up finding last year’s Halloween candy instead! Statisticians use various tools to keep their data neat and tidy, including essential tools statisticians use.
One popular way to organize data is by using spreadsheets like Microsoft Excel or Google Sheets. These programs allow statisticians to create tables, where they can enter data in rows and columns. This structure makes it easy to find and compare information. Plus, with all those colorful charts and graphs, it’s like decorating your room with posters!

Cleaning Data: Key Techniques for Accurate Analysis
After organizing, the next crucial step is cleaning the data. Just like washing your hands before dinner, cleaning data ensures that it’s ready for analysis. Sometimes, data can be messy or have mistakes. For example, a survey might accidentally list “Blue” and “blu” as different answers. A statistician needs to spot these errors and fix them. Among the tools statisticians use for cleaning data, R and Python are fantastic choices.
Tools like R and Python are fantastic for cleaning data. They allow statisticians to write code that finds errors and inconsistencies. It’s a bit like having a magical broom that sweeps away all the dirt! However, cleaning can be tedious. Picture a detective searching for clues; it takes time, but it’s essential for finding the truth.
Analyzing Data: Uncovering Insights with Statistical Methods
Once the data is organized and cleaned, it’s time for the fun part: analysis! This is where statisticians can uncover patterns and insights. They use various statistical methods and tools to understand what the data is telling them. This phase truly highlights the tools statisticians use for in-depth data analysis.
One of the most exciting tools for analysis is JMP. JMP is like a super-smart friend who loves to help with numbers. It’s user-friendly, which means that even those who aren’t math geniuses can use it. With JMP, statisticians can create visualizations, run simulations, and perform statistical tests all in one place. Imagine having a magical toolbox filled with everything you need for a science project!
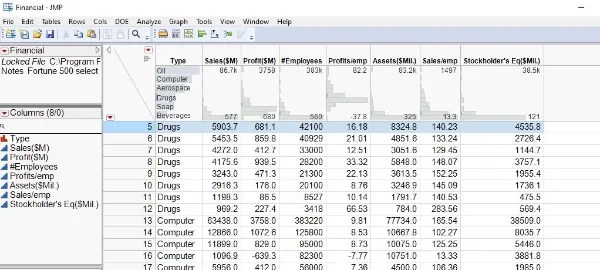
JMP: My Favorite Data Analysis Tool
Now, let’s take a closer look at JMP. What makes it my favorite? First of all, JMP makes it easy to explore data visually. You can create graphs with just a few clicks. Want to see how students’ test scores change with study hours? Just drag and drop! It’s almost like playing a video game where you can see the results instantly.
Moreover, JMP has a great feature called “Dynamic Data Filtering.” This tool lets you adjust your data view on the fly. So, if you want to focus on students who studied more than five hours, you can easily filter it out. It’s like having a magic wand that shows you only what you want to see!

Collaborating with Others: Enhancing Teamwork in Statistics
Statistics is rarely a solo activity. Statisticians often work in teams. Thus, tools that help with collaboration are important. Programs like Google Sheets allow multiple users to view and edit data at the same time. These collaboration tools statisticians use make it easy for teams to brainstorm and discuss findings together.
JMP also supports collaboration through its sharing features. You can share your analysis with colleagues in a snap. So, when someone asks, “What’s the story behind these numbers?” you can provide them with a neat report. It’s like showing off your science fair project, but with way more data!

Presenting Findings: Effective Storytelling with Data
Once the analysis is complete, the last step is presenting the findings. Good statisticians know that data is only as good as how it is shared. They need to tell a story with the data, so others can understand the insights. This often involves creating slideshows or reports. Among the many tools statisticians use, JMP is excellent for presenting results effectively.
JMP shines here as well. It can generate reports that include your graphs and findings. This makes it easier to present data in a way that is clear and engaging. Imagine being in a classroom, and your project stands out because it’s colorful and informative. That’s the power of good presentation!

Conclusion: The Magic of Statistics
In conclusion, statisticians have a toolbox full of great tools to help them organize, clean, and analyze data. While programs like Excel and Python are useful, JMP stands out for its user-friendly features and powerful analysis capabilities. So, the next time you think of statisticians, remember the diverse tools they use—they’re not just crunching numbers—they’re uncovering stories hidden in data, one click at a time!
Now, if you ever need to organize your room or clean up your homework, just think of the statisticians. They show us that with the right tools, even the messiest data can become something beautiful. Who knew statistics could be so magical?
To learn more about my services, check out my blogs for more insights, or visit my About Me page to discover my journey in the world of statistics!
Discover more from Topline Statistics
Subscribe to get the latest posts sent to your email.
Are you drowning in data?
Let us help! Our experts will navigate, organize, and analyze your data, bringing forth clarity and actionable recommendations.