

Organizing Football Statistics: The Role of Sports Statisticians
In the world of American football, every match is a complex narrative. It is filled with data that tells the story of teams and players. Sports Statisticians organize this data. They summarize performance. This summary makes it easier for fans, analysts, and coaches to glean insights. A critical element in this organization is the use of a two-row structure for each match. This structure allows for a clear comparison between competing teams.
The Importance of Data Organization
In today’s digital age, many fans and analysts use sports websites to find important statistics. They often look for details like win-loss records between teams. For example, they might want to know how one team has performed against another over the last five years. They may also be interested in performance during their last ten games. Organized data is essential for this kind of research.
Fans want to see if their team has consistently beaten its rival or scored more points overall. This clear organization of statistics makes it easy for users to find the information they need. As a result, they can engage more deeply with the sport. It also helps them understand team dynamics and historical performance better. Overall, sports Statisticians enhance the experience for both fans and analysts.
The Two-Row Structure
When collecting data for each match, a sports statistician typically employs a two-row format. This approach provides a clear representation of both teams involved in the match.
Example of a Two-Row Data Structure
Let’s look at all the matches between Team A and Team B. A statistician would organize the data like this:

In this example, each team has its own row under both the ‘Team Name’ and ‘Opponent Name’ columns. This setup makes it easy to understand their records. Since one game involves two teams, we need two rows for each game. If I only recorded the score in one row, you would have to check both columns to find the stats. This could be confusing. By adding a second row for the other team, it becomes simpler to search.
Now, let’s see how the database looks when filtered for one team, and then switched to the other:
Search: Green Bay Packers

Search: Chicago Bears
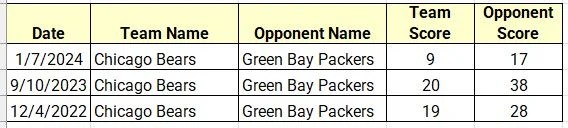
In these examples, there are six rows of data instead of just three. We only show three at a time because we focus on one team’s stats. This way, the information remains clear and easy to follow.
Advantages of the Two-Row Approach
- Clarity and Consistency
By listing both teams in separate rows, the data is much easier to read and understand. This clear layout helps analysts quickly grasp what happened in each match. - Simplified Comparisons
The two-row format makes it easy to compare teams. You can see quickly that the Green Bay Packers have won their last three games. They played against the Chicago Bears. - Ease of Updates
As teams play more matches, updating a two-row structure is simple. You can easily add new rows for each game while keeping everything organized. This way, all the important data stays in one place.
Summarizing Data for Analysis
Once the data is organized, sports Statisticians can summarize the information in various meaningful ways:
- Win/Loss Ratios: Calculating the win/loss ratio helps identify which teams are performing above or below expectations. For example, Team A’s win percentage can easily be calculated, providing a quick overview of their success.
- Head-to-Head Records: The two-row data structure makes it easy to determine the head-to-head performance between teams. It offers insights into which styles or strategies have historically worked well against each other.
- Trend Analysis: Over time, this data organization enables statisticians to analyze trends. They can determine whether certain teams consistently perform well in specific conditions. They can also assess performance against specific opponents.
Conclusion
In the fast-paced world of football, sports Statisticians play a key role in understanding all the data from each match. Using a two-row structure to organize match data helps make the information clearer and easier to analyze. This method allows everyone—from coaches to analysts and fans—to see how teams perform over time and appreciate the game’s complexities. As football evolves, the need for careful data organization will grow. This will help us explore the exciting stories of competition even more.
If you’d like to read more about sports, check out my blogs on Baseball. You can explore Most Wins by Baseball Teams in Recent Decades – Topline Statistics. Also, see Reimagining Baseball: A Statistician’s Vision for a Better Season – Topline Statistics. For insights on statistics, visit the Topline Statistics blog page.
Discover more from Topline Statistics
Subscribe to get the latest posts sent to your email.
Are you drowning in data?
Let us help! Our experts will navigate, organize, and analyze your data, bringing forth clarity and actionable recommendations.